Turning Numbers into Meaningful Visuals with with engaging Charts & Graphs
In an increasingly data-intensive enterprise environment, data visualization plays a critical role in turning complex information into clear, actionable insights. VE3 helps mid-size enterprises and large organizations design and deliver intelligent visualization solutions that improve understanding, accelerate decision-making, and drive measurable business outcomes.
Our data visualization services combine intuitive design, modern analytics platforms, and scalable architectures to ensure insights are accessible, meaningful, and actionable across the organization.
Why Data Visualization Matters
As data volumes grow, static reports and spreadsheets are no longer sufficient. Leaders need interactive and real-time visual insights to quickly identify trends, detect anomalies, and make confident, data-driven decisions across the organization.
We offer end-to-end data visualization services designed to support modern enterprise analytics needs.
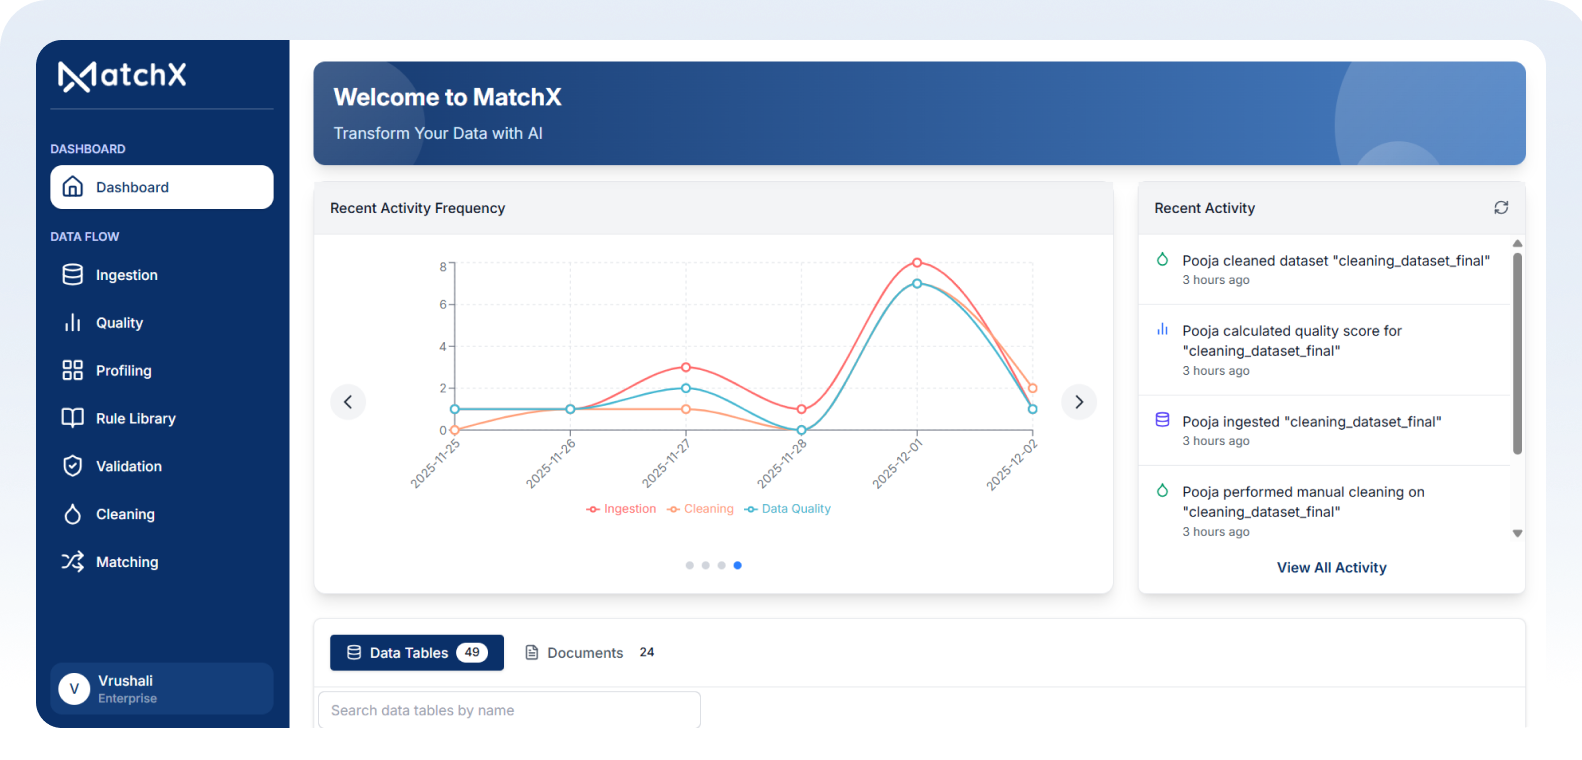
We design intuitive dashboards that present key metrics through interactive charts, filters, and drill-downs. These dashboards provide real-time visibility and enable users to explore data at multiple levels of detail.

Our visualization solutions focus on clarity and context. We create story-driven visuals that simplify complex data and help stakeholders understand the “why” behind the numbers.
We enable self-service visualization capabilities that allow business users to create, customize, and share dashboards independently reducing dependency on IT and accelerating insights.

We embed visual insights directly into enterprise applications, portals, and workflows so users can access analytics at the point of decision, improving adoption and impact.

We build real-time visualization solutions that support operational monitoring and rapid response. This enables teams to track live performance, detect issues early, and act immediately.

We enhance visualizations with AI-driven capabilities suchas automated insights, trend detection, and predictive indicators helping organizations move from descriptive to forward-looking analytics.

Our visualizations are designed for accessibility across devices, ensuring insights are available on desktops, tablets, and mobile devices for distributed and remote teams.

We establish visualization best practices and governance frameworks to ensure consistency, accuracy, security, and trust across dashboards and reports.
Our data visualization approach is structured, scalable, and focused on business outcomes:
Identify business goals, users, and data sources

Create intuitive, scalable visualization frameworks

Build interactive dashboards and visual analytics
Embed insights into BI platforms and workflows
Continuously improve usability, performance, and value
This approach ensures visualization solutions remain relevant as business needs evolve.
We enables businesses to efficiently handle and process large volumes of data and we also build robust data pipelines, optimise storage and processing,
Organizations choose VE3 for data visualization because we combine analytics expertise with strong design and business understanding.

.png)


We don’t just visualize data, we help organizations understand it and act on it.
Our Business Intelligence services support complex, data-intensive environments across industries, including:
Stay current with the strategies, trends, and technologies defining the next era of digital excellence.


Effective data visualization transforms complexity into clarity. VE3 helps you empower teams with intuitive visual insights that support faster, smarter decisions.
Connect with our experts to modernize your data visualization capabilities and unlock greater business value from your data.
Let's Connect.png)
Innovating Ideas. Delivering Results.
.png)


